The 4 Pillars of Data Lineage: How Alation Catalogs Your Data's Journey

By Mendelsohn Neil Chan
Published on February 6, 2025

Data is at the core of every modern business decision, but without visibility into where it comes from, how it changes, and where it’s used, organizations risk making decisions based on incomplete or inaccurate information. Data lineage provides the critical transparency needed to track the end-to-end journey of data—from raw ingestion to transformation, reporting, and beyond. With a clear view of data movement and dependencies, businesses can drive better governance, improve data quality, and accelerate data-driven innovation.
In this blog, we’ll explore the four key pillars of data lineage that Alation uses to systematically catalog data, showing how Alation empowers data teams through lineage. Whether you’re a data engineer ensuring pipeline integrity or a business user validating reports, this framework will help you harness the full power of data lineage to drive confident decision-making.
A simple framework to understand data lineage
As a technical architect helping organizations tackle their most demanding data governance challenges, I often hear one common requirement from data teams: "How can we catalog end-to-end data lineage?"
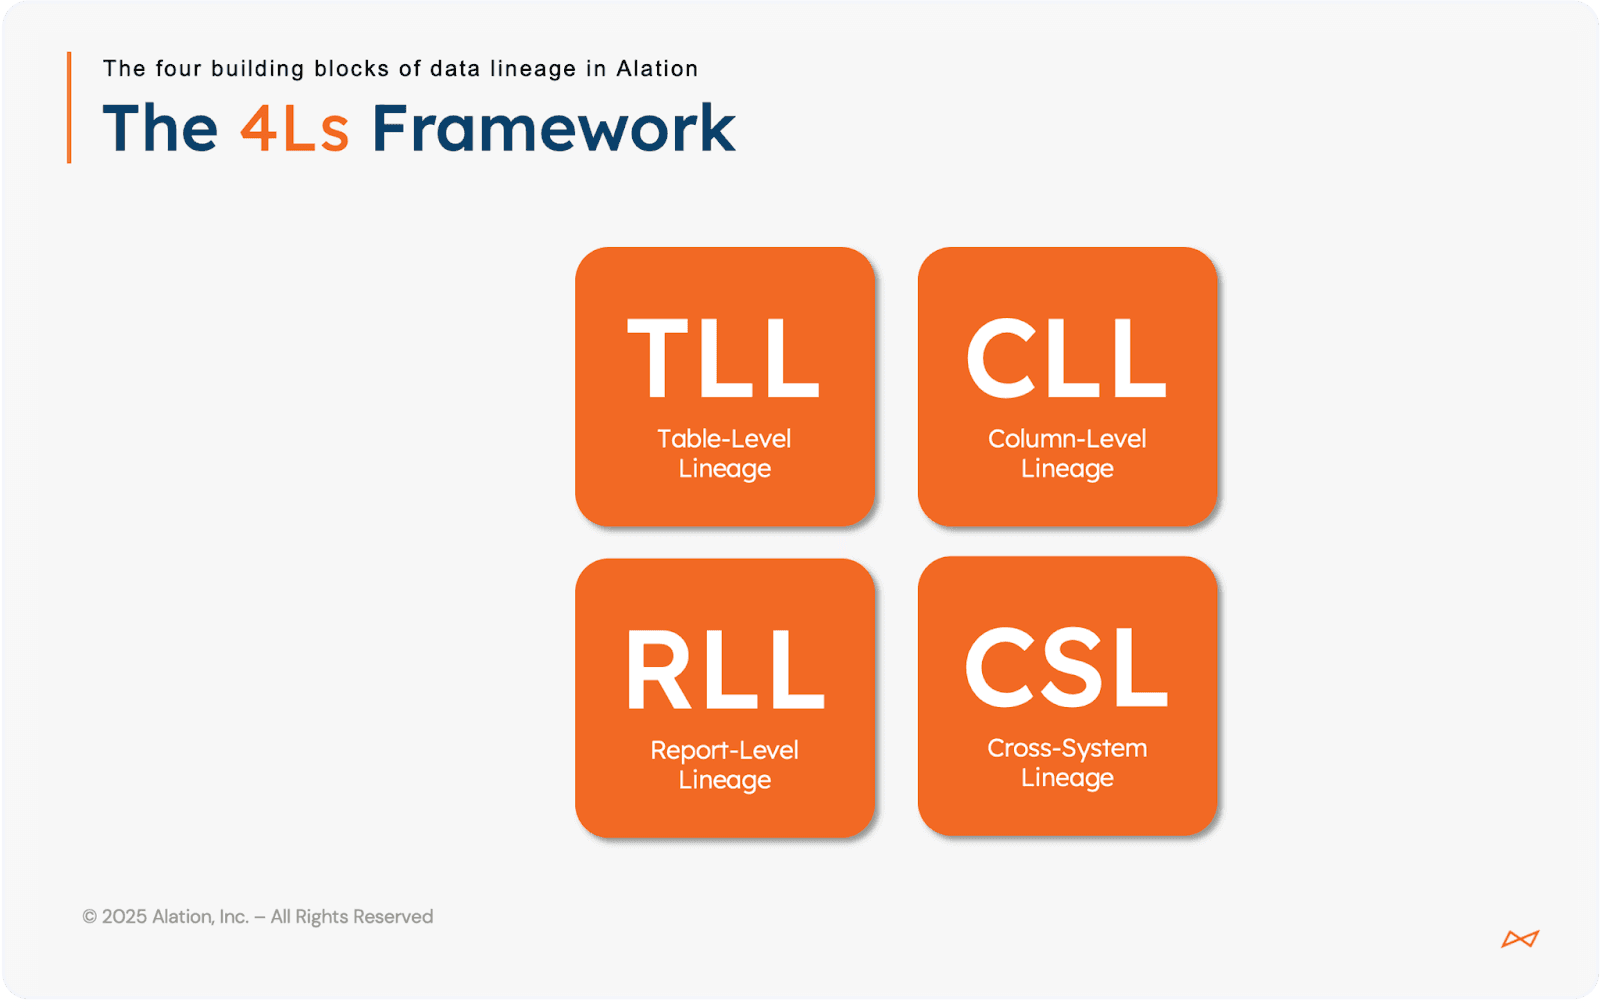
Since data lineage touches on many different facets, I want to break it down into something more digestible. In this blog, I'll outline a simple yet powerful framework to understand how lineage works based on four key concepts - the "4Ls of Data Lineage" - that demonstrate how Alation methodically catalogs every step of your data’s journey, making it easier for you to understand, trust, and leverage your data.
A simple framework to understand the different facets of data lineage.
Alation helps organizations catalog the entire journey of their data through four sub-areas:
• Pillar 1: Table-Level Lineage (TLL)
• Pillar 2: Column-Level Lineage (CLL)
• Pillar 3: Report-Level Lineage (RLL)
• Pillar 4: Cross-System Lineage (CSL)
Pillar #1: Table-Level Lineage (TLL)
The first pillar of data lineage is called Table-Level Lineage (TLL). This capability area monitors the journey of your data as it undergoes incremental cleansing, transformation, and aggregation in your data pipelines. In modern data management, many organizations follow an architectural paradigm known as the Medallion Architecture, where data sets are modularized and cleansed incrementally across three stages: Bronze (Raw Data), Silver (Clean Data), and Gold (Aggregated Data).
In this discussion, the term “table” is used loosely. TLL, as a core feature in Alation's Open Connector Framework (OCF), supports the many ways modern data platforms (e.g., Snowflake, Databricks, BigQuery, Redshift) persist "tables" under the hood. Whether you’re dealing with managed tables, external tables, materialized views, or standard views, Alation's TLL capability provides a consistent way to represent and understand how your data moves and evolves.
Visualizing Table-Level Lineage in Alation
For example, consider a data pipeline running in Google BigQuery. Alation can programmatically extract and visualize the various stages of the data transformations applied. It renders a clear lineage graph that outlines the data’s journey through different layers and extracts the underlying SQL transformations, including the data definition language (DDL) and data manipulation language (DML), executed against the warehouse. This dual approach offers a high-level visual summary and the technical details needed to validate and troubleshoot your data processes.
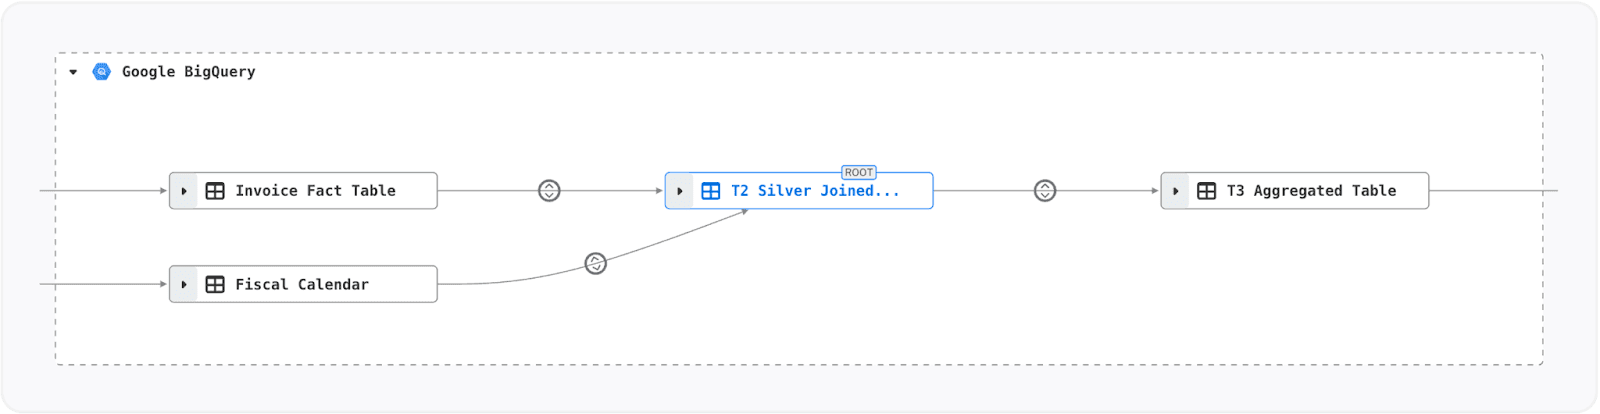
Table-level lineage (TLL) in a BigQuery pipeline.
How Alation powers data intelligence: MDE + QLI
Alation makes all this possible through two core processes that underpin its Data Intelligence Platform: Metadata Extraction (MDE) and Query Log Ingestion (QLI). These jobs are scheduled to run regularly, extracting raw SQL queries compiled and executed against your data warehouse’s compute engine. In most cases, Alation taps into the INFORMATION_SCHEMA — a veritable treasure chest of query history and metadata.
By capturing the underlying SQL queries and detailed query execution logs, Alation is able to surface valuable insights into how end users are interacting with company data. This process reveals which tables are most popular and frequently accessed, and it uncovers table relationships that might otherwise go unnoticed by newcomers. These insights not only highlight data consumption trends but also help inform data governance and optimization strategies, ensuring that your Data Intelligence Platform is both powerful and responsive to real-world user behavior.
Once this rich dataset is collected, Alation’s Behavioral Analytics Engine (BAE) analyzes key details such as query text, start times, end times, and execution status.
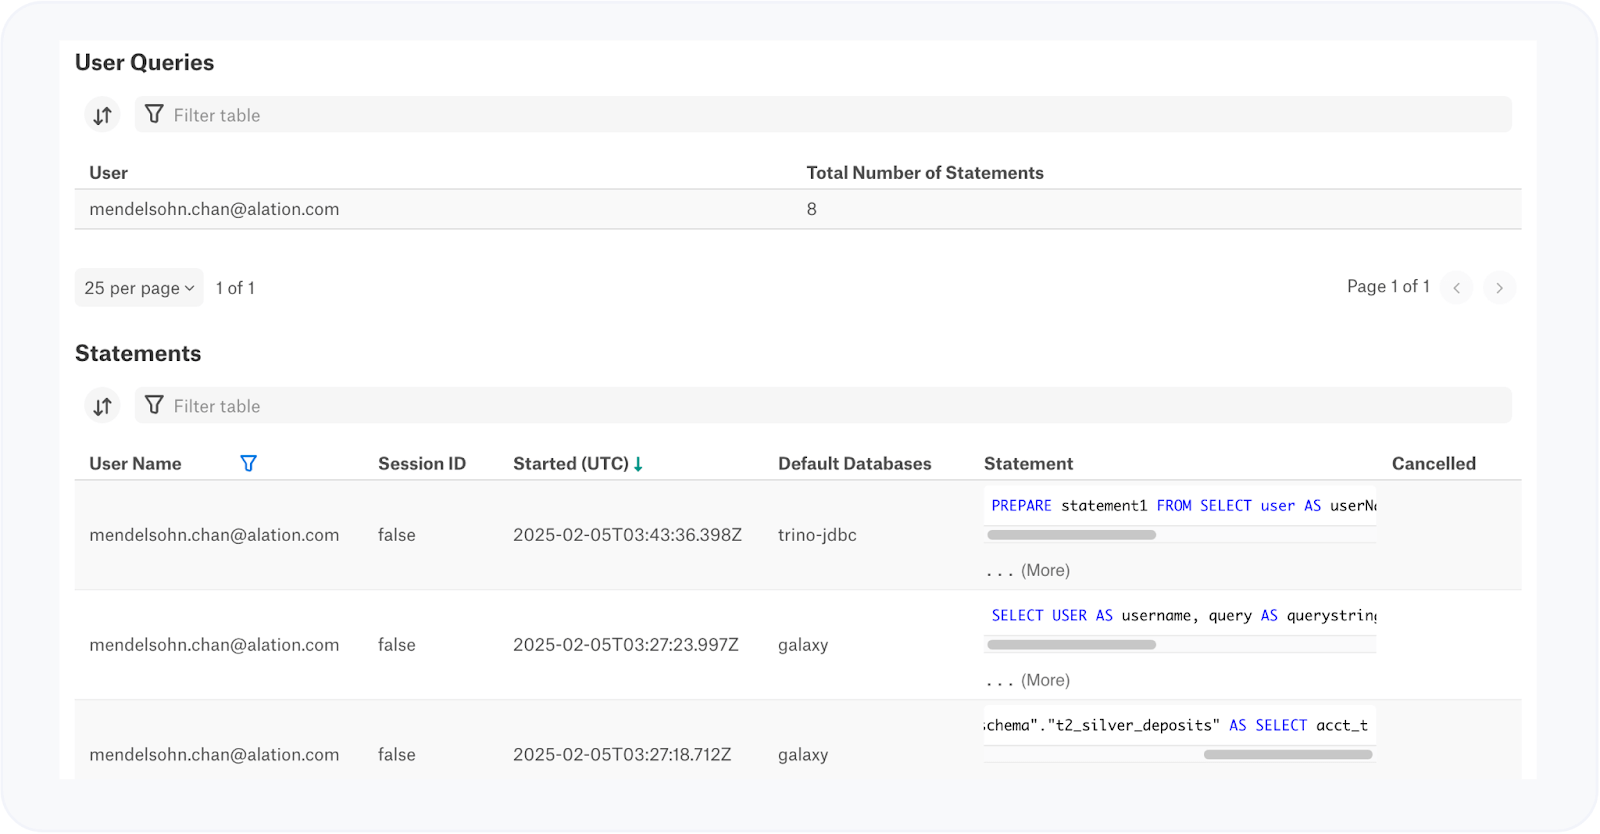
Query Log Ingestion (QLI) configuration page in Alation.
The result? End users receive rich context about how their pipelines are built, enabling them to make more informed decisions about data governance and transformation.
Alation is able to capture the SQL transformation logic executed in a data pipeline.
Pillar #2: Column-Level Lineage (CLL) in Alation
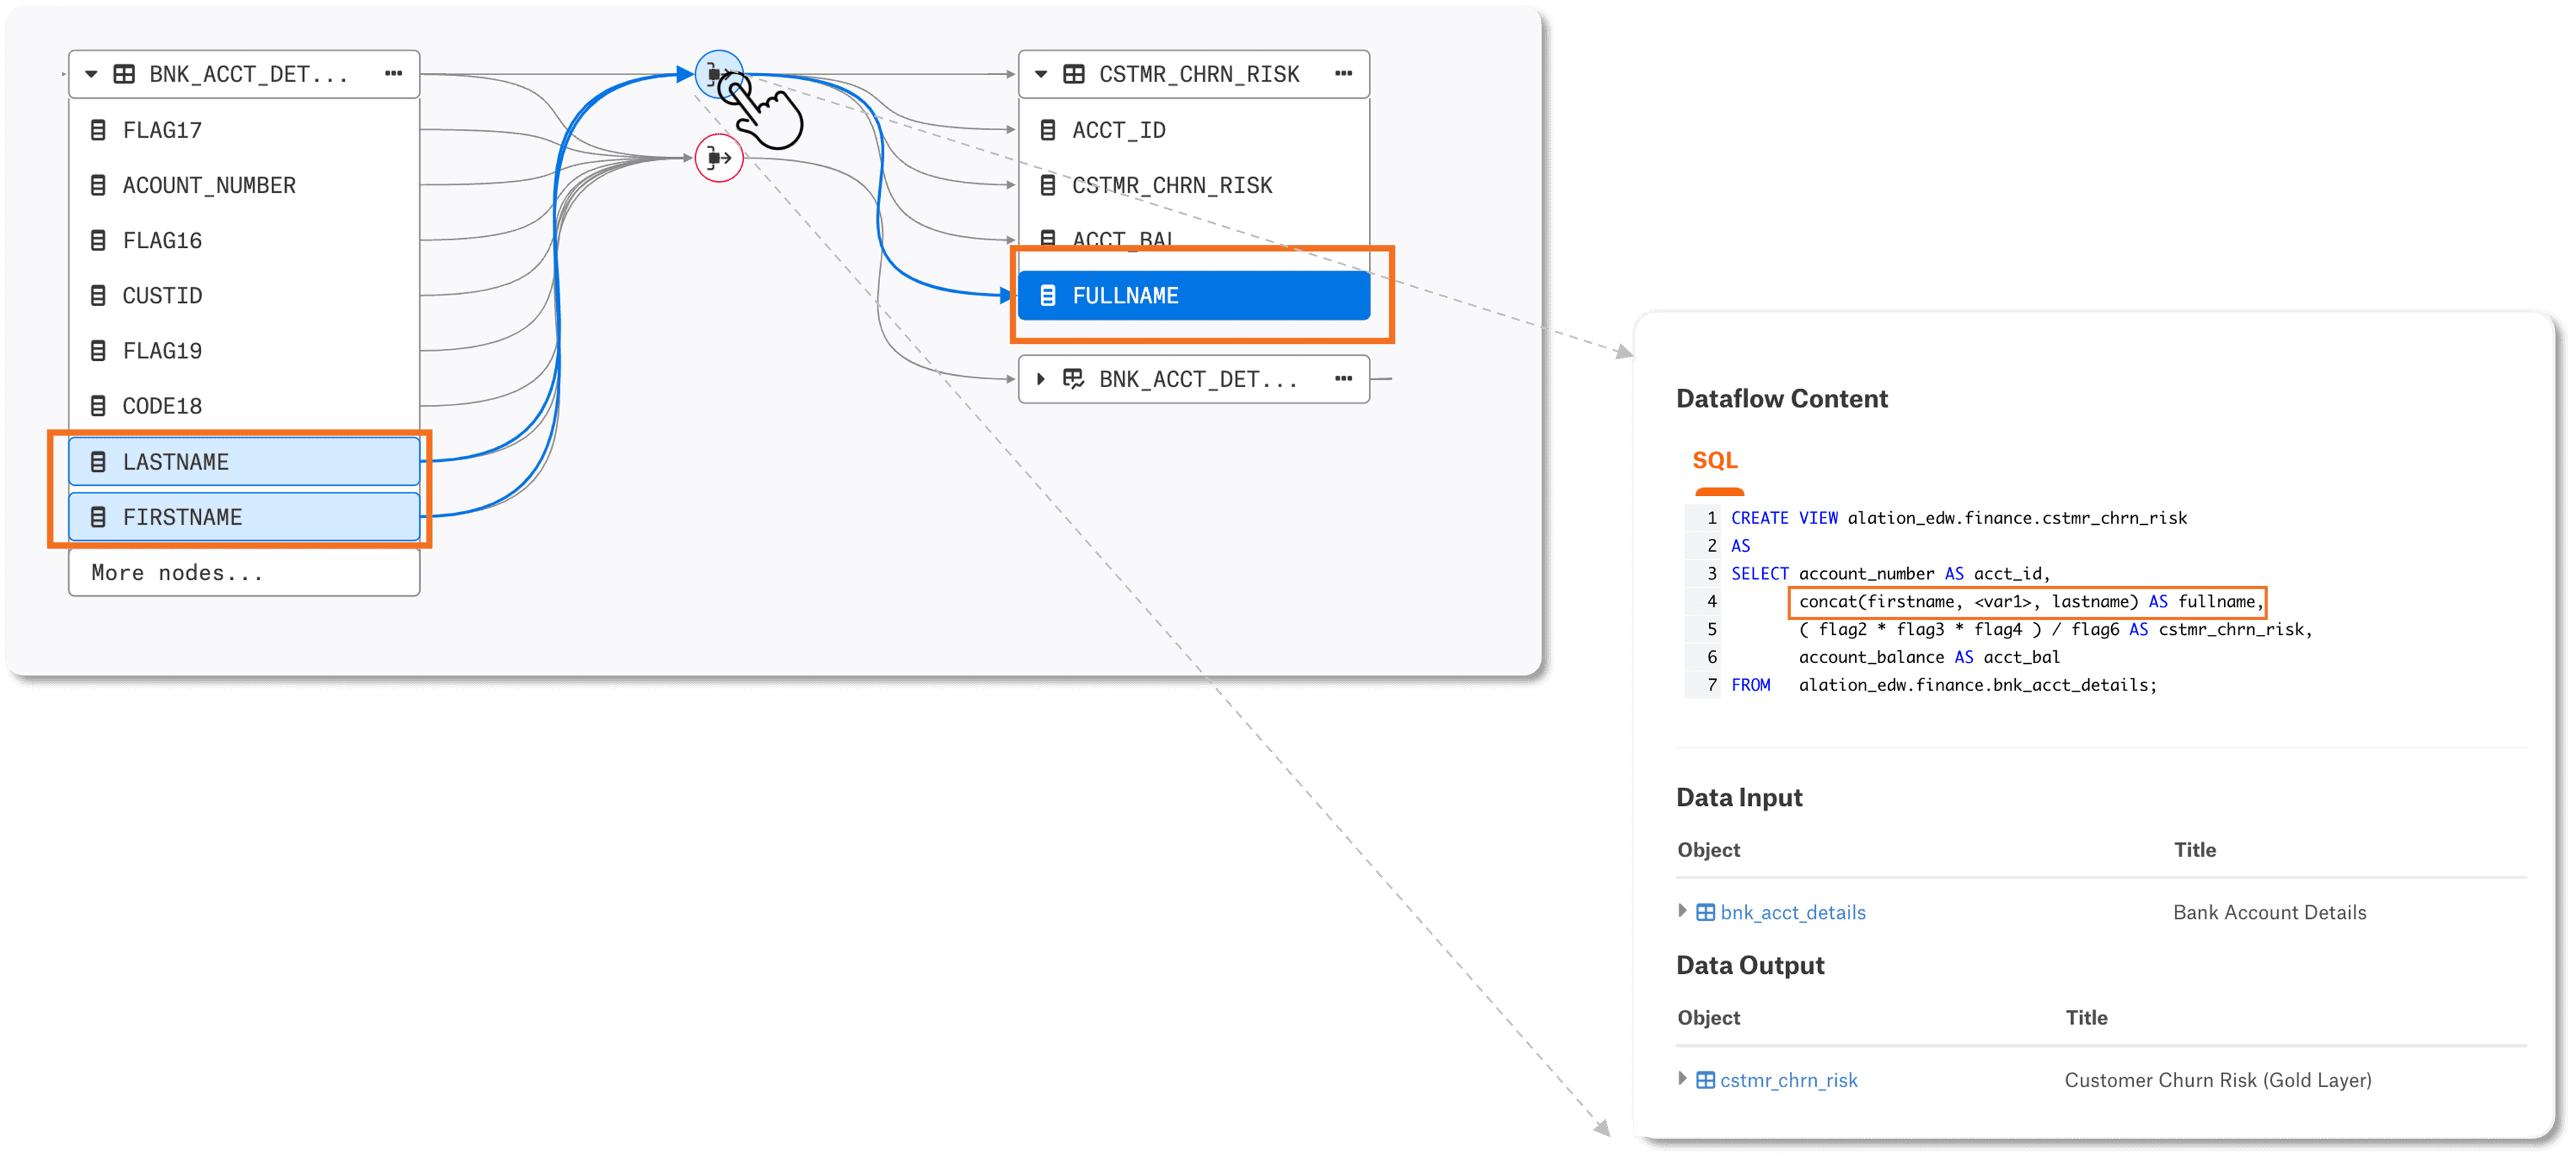
Building on top of Table-Level Lineage, Column-Level Lineage (CLL) takes data lineage analysis to a more granular level, providing detailed insights into how individual columns of data are transformed and propagated across systems. This added layer of detail is crucial for technical engineers and business users who rely on accurate data for decision-making.
Why Column-Level Lineage matters
CLL is more than just an advanced technical feature—it is vital for ensuring transparency, accuracy, and compliance in data-driven organizations. By tracking data transformations at the column level, teams can troubleshoot data issues, optimize data pipelines, and confidently maintain regulatory compliance.
CLL for technical users
For data engineers and architects, CLL plays a key role in understanding data movement and transformations across various ETL/ELT pipeline stages. Some common scenarios where CLL is invaluable include:
Casting and renaming fields: Understanding how column names and data types change during transformations ensures compatibility and consistency across data models.
Tracking joins and lookups: Knowing which columns are used in table joins and lookups helps optimize query performance and ensure data accuracy.
Multi-column transformations and aggregations: Identifying how different columns contribute to derived fields, such as calculating sales revenue from [Quantity] x [Price], allows for better data validation and debugging.
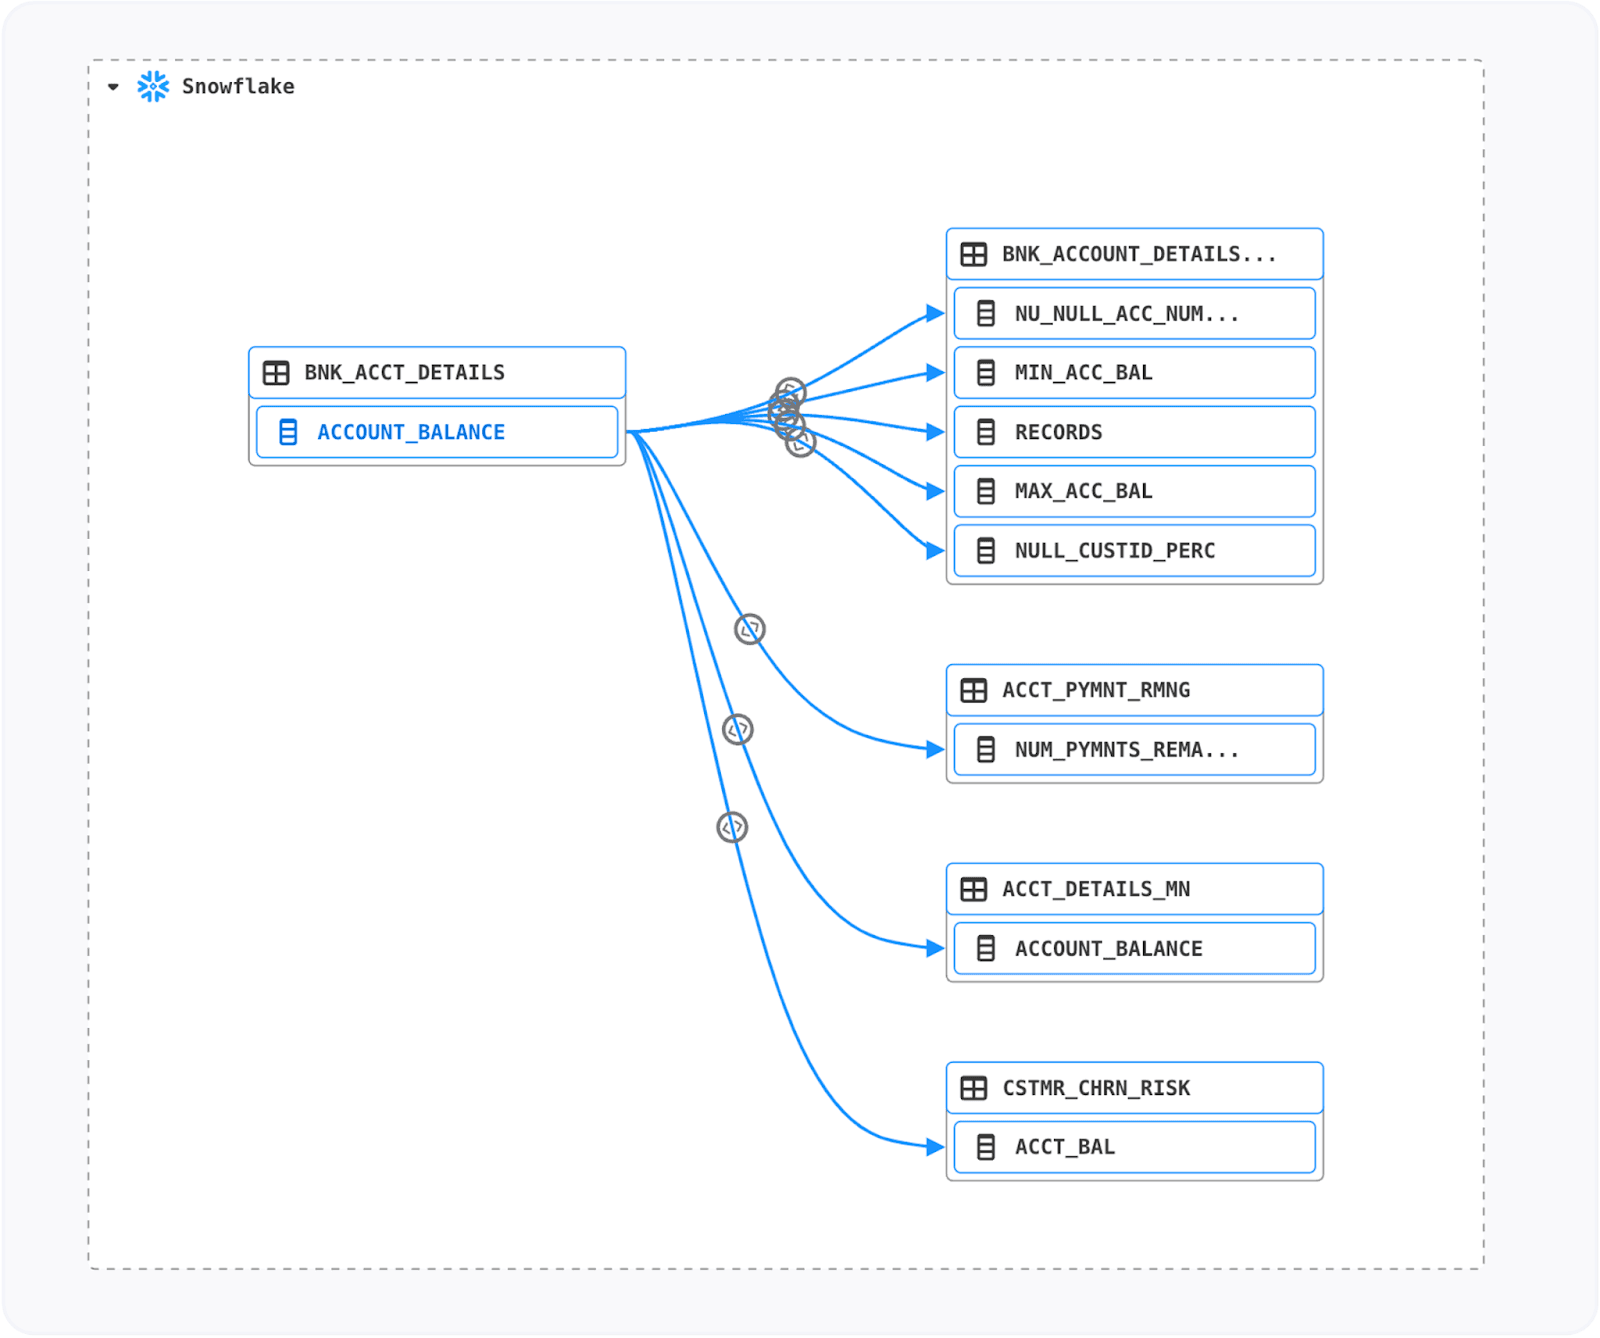
Column-level lineage example in Snowflake.
CLL for business users
From a business perspective, Column-Level Lineage is critical in maintaining trust in key business metrics and ensuring that KPIs are calculated correctly. Here are a few ways Alation empowers business users through CLL:
Auditing BI formula discrepancies: For example, if a [Year to Date Sales] metric appears incorrect, Alation can reveal that a Data Analyst used a different date cutoff in a DATE_TRUNC formula that didn’t align with the company’s fiscal calendar.
Regulatory compliance and PII tracking: Organizations subject to HIPAA, GDPR, or PIPEDA must maintain an inventory of Personally Identifiable Information (PII). CLL helps enforce data controls by mapping out where sensitive attributes exist and how they’re used and governed.
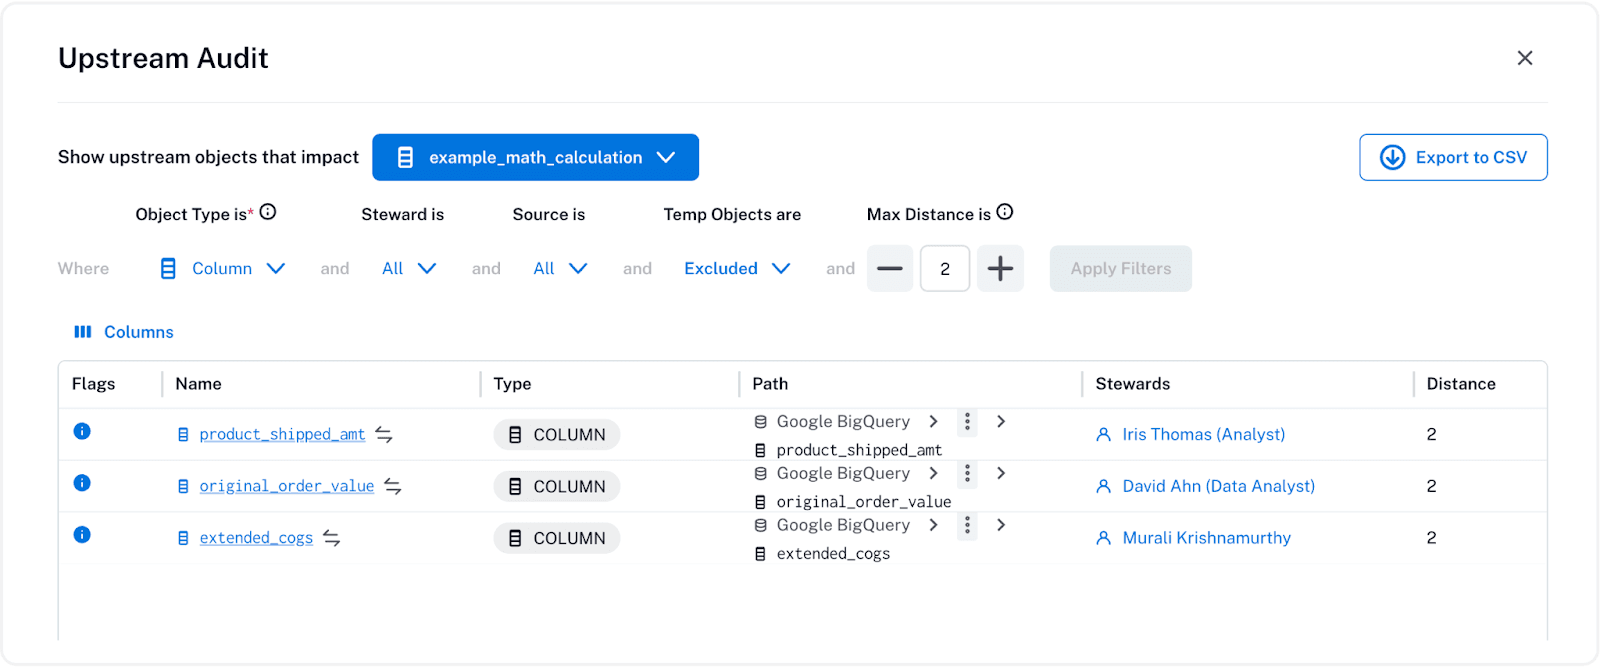
Metric validation across multiple systems: A bank tracking the [Loan to Value Ratio] KPI across Loan Origination, Core Banking, Decision Support, and Business Reporting Systems can use CLL to ensure consistency and detect discrepancies.
![Business lineage to audit [Account Number] across multiple systems](/_next/image/?url=https%3A%2F%2Fimages.ctfassets.net%2F7p3vnbbznfiw%2F6g84hxV27e7uObMNdDbM69%2Fb7d972db653b0d37af11063a06ad21bc%2FBusiness-lineage-Alation-audit.png&w=3840&q=75)
Business lineage to audit [Account Number] across multiple systems.
Visualizing Column-Level Lineage in Alation
Alation provides two intuitive ways to explore CLL: a graphical representation and a tabular view. The graphical view shown in the two examples above visually maps column-to-column dependencies, helping users quickly understand relationships between data elements. Meanwhile, the tabular view provides a structured breakdown of transformations, making it easy to audit and validate data changes at a granular level.
Tabular report depicting the source columns of an aggregated metric.
Alation's CLL capabilities enable both technical and business users to trace data lineage with precision. This strengthens data governance, enhances analytics accuracy, and ensures compliance—all within a user-friendly interface.
Pillar #3: Report-Level Lineage (RLL) in Alation
Alation's third pillar of data lineage focuses on the Business Intelligence (BI) and analytics layer, providing visibility into how data flows through reports, dashboards, and visualizations. For simplicity, the term "report" is used broadly in this section to encompass various BI objects, including charts, dashboards, and detailed reports.
Understanding Report-Level Lineage
A common best practice in BI is to create a tabular, cached representation of a table in the BI tool—often referred to as a BI Data Source in Alation. These data sources act as a foundation upon which multiple reports and dashboards are built, ensuring consistency and performance optimization. This structured approach allows organizations to track data lineage from raw sources to business-facing reports, enhancing trust and traceability in reporting.
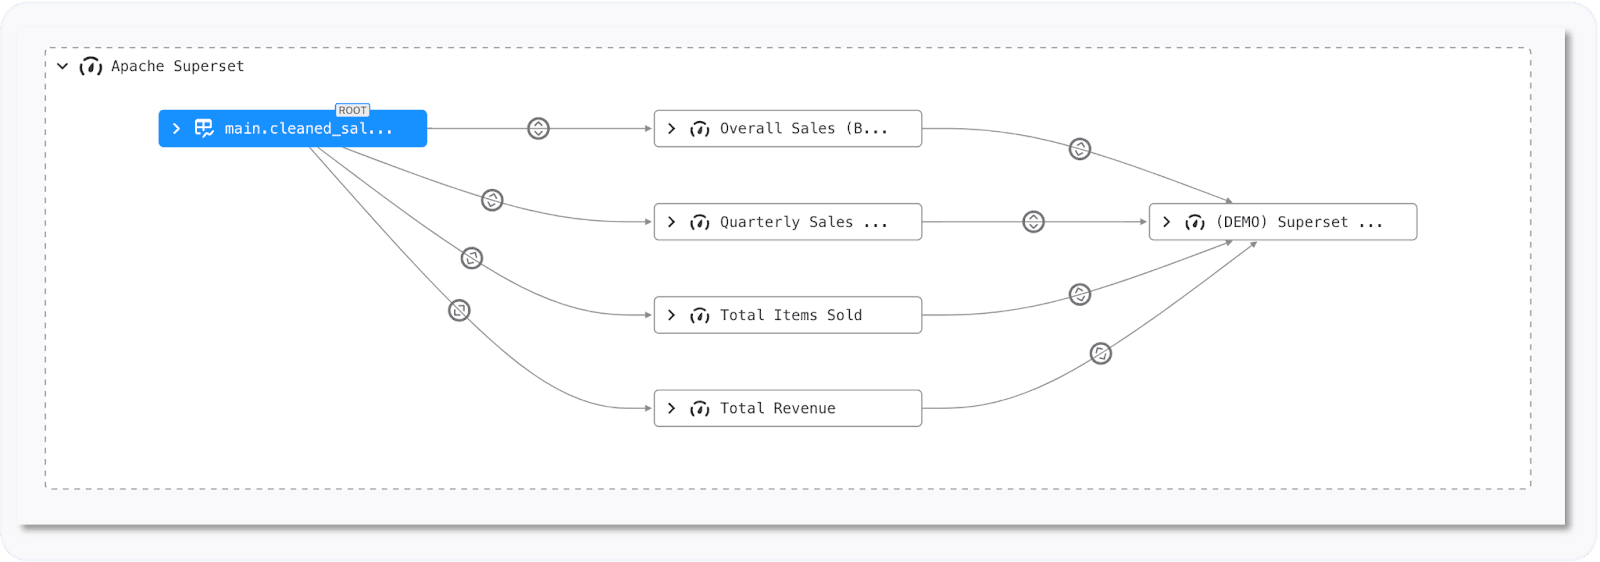
Report-level lineage in Apache Superset, a popular open-source BI tool.
Alation’s support for Report-Level Lineage
Alation supports RLL for leading enterprise-grade BI tools, including Tableau, Power BI, QlikSense, and Looker. Additionally, we extend support to open-source BI tools such as Metabase and Apache Superset through our powerful Universal BI Enhanced Connector. This ensures seamless integration across diverse BI ecosystems, catering to the needs of different departments within large enterprises.
By enabling comprehensive visibility into report-level dependencies, Alation empowers both data teams and business users to trust their analytics, optimize performance, and maintain compliance with evolving data governance standards.
Pillar #4: Cross-System Lineage (CSL)
Finally, we arrive at the fourth and final pillar of data lineage: Cross-System Lineage (CSL). This capability combines all the earlier pillars' insights into one cohesive, end-to-end view, showing exactly how data travels across your organization’s ecosystem. By seeing each “hop” or layer — whether it’s a source system, data lake, data warehouse, or BI tool — you gain full transparency into the data’s journey, enabling better governance, optimized transformations, and increased trust in your analytics.
From an architectural standpoint, Alation supports an array of these design patterns through REST APIs and native Open Connector Framework (OCF) connectors, creating a unified lineage map for all your data assets. Here are some of the most common ways organizations stitch together multiple systems to achieve full visibility:
Pattern #1: (Table → BI Report)
Example: A SQL Server table might feed directly into a Power BI dashboard, giving users an immediate, interactive view of the data’s origin and transformations.
Pattern #2: (Source System → Data Lake → Data Warehouse → BI Tool)
Example: Batch CSV files from an OLTP database get staged in AWS S3, then loaded into Snowflake for transformations. Finally, Tableau connects to Snowflake’s Virtual Warehouse to build powerful, visual dashboards.
Pattern #3: (Source System → Data Lakehouse → BI Tool)
Example: Once data is ingested into ADLSGen2 as raw Parquet files, Databricks processes it using PySpark and writes it back to ADLSGen2 as Delta Lake tables. Apache Superset then connects through Databricks’ native DB API 2.0 driver to generate BI reports for the business.
Pattern #4: (Source System → Data Lake → Metastore → Query Engine)
Example: CSV files are staged in AWS S3 and are converted to Parquet via AWS Glue, which also registers the schema in the Glue catalog. Amazon Athena then queries the Parquet files directly from S3, leveraging Glue’s schema for fast, serverless analytics.
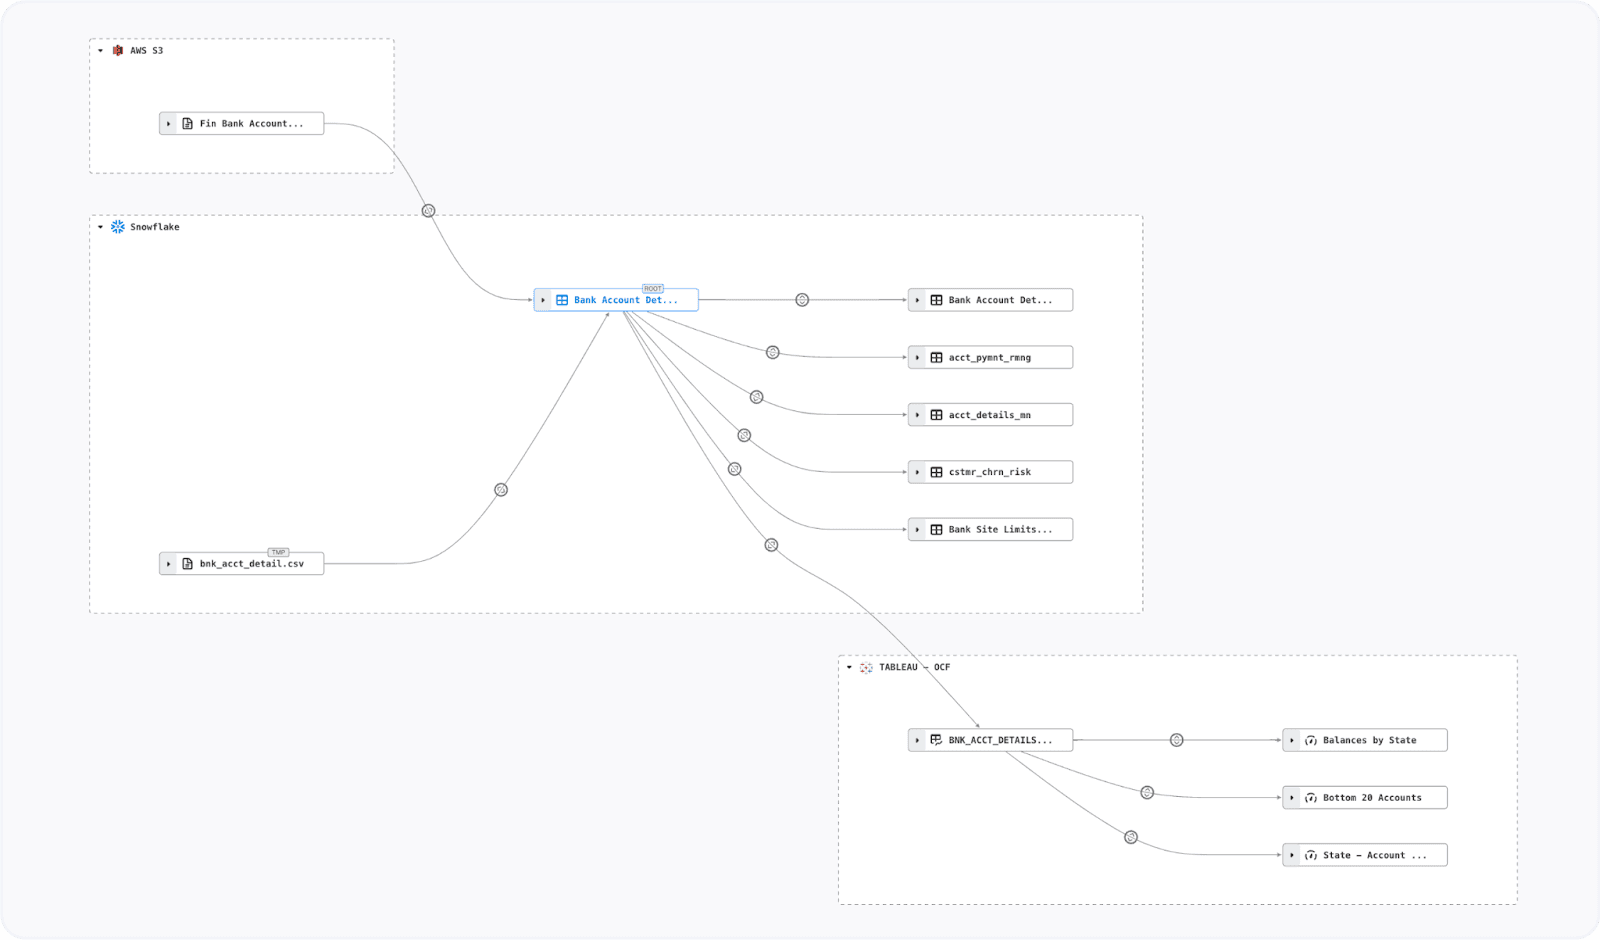
Cross-system lineage between AWS S3, Snowflake, and Tableau.
Visualizing Cross-System Lineage in Alation
These patterns underscore the flexibility and breadth of Alation’s lineage capabilities. With Cross-System Lineage, you can track data from the moment it’s created to the point where it powers critical business decisions—all within a single platform designed to keep your data ecosystem connected and transparent.
Conclusion
Alation’s robust lineage framework offers a comprehensive view of data origins, transformations, and final destinations. We hope you enjoyed this technical blog and found it helpful. Don't hesitate to contact your Alation account manager if you have any questions, and keep an eye out for more cool Alation blog tutorials coming your way soon.
- A simple framework to understand data lineage
- Pillar #1: Table-Level Lineage (TLL)
- Pillar #2: Column-Level Lineage (CLL) in Alation
- Pillar #3: Report-Level Lineage (RLL) in Alation
- Pillar #4: Cross-System Lineage (CSL)
- Conclusion
Contents
Tagged with
Loading...